
Why Solar Performance Lives in the Time Domain: Moving Beyond Peak Sun Hours (PSH)
Peak Sun Hours (PSH) are one of the most widely used concepts in solar PV design. They appear constantly in commercial proposals, engineering spreadsheets, software simulation tools, and client conversations — often without much explanation. In Pakistan’s solar market, PSH are frequently treated as if they represent actual operating hours at full power.
This interpretation is convenient, highly intuitive, and unfortunately incorrect. Understanding what PSH really represent — and what they hide — is essential for designing reliable commercial PV and hybrid storage systems, especially where seasonal autonomy and performance guarantees matter.
What Peak Sun Hours Actually Are (and Aren’t)
Peak Sun Hours are a normalised energy metric, not a clock measurement. They represent the total daily solar irradiation expressed as an equivalent number of hours at a standard reference irradiance of 1 kW/m².
Mathematically, PSH are simply the area under the irradiance-versus-time curve, compressed into a single, digestible number. They do not imply that:
PSH are a pure energy abstraction, not a physical description of daily system operation.
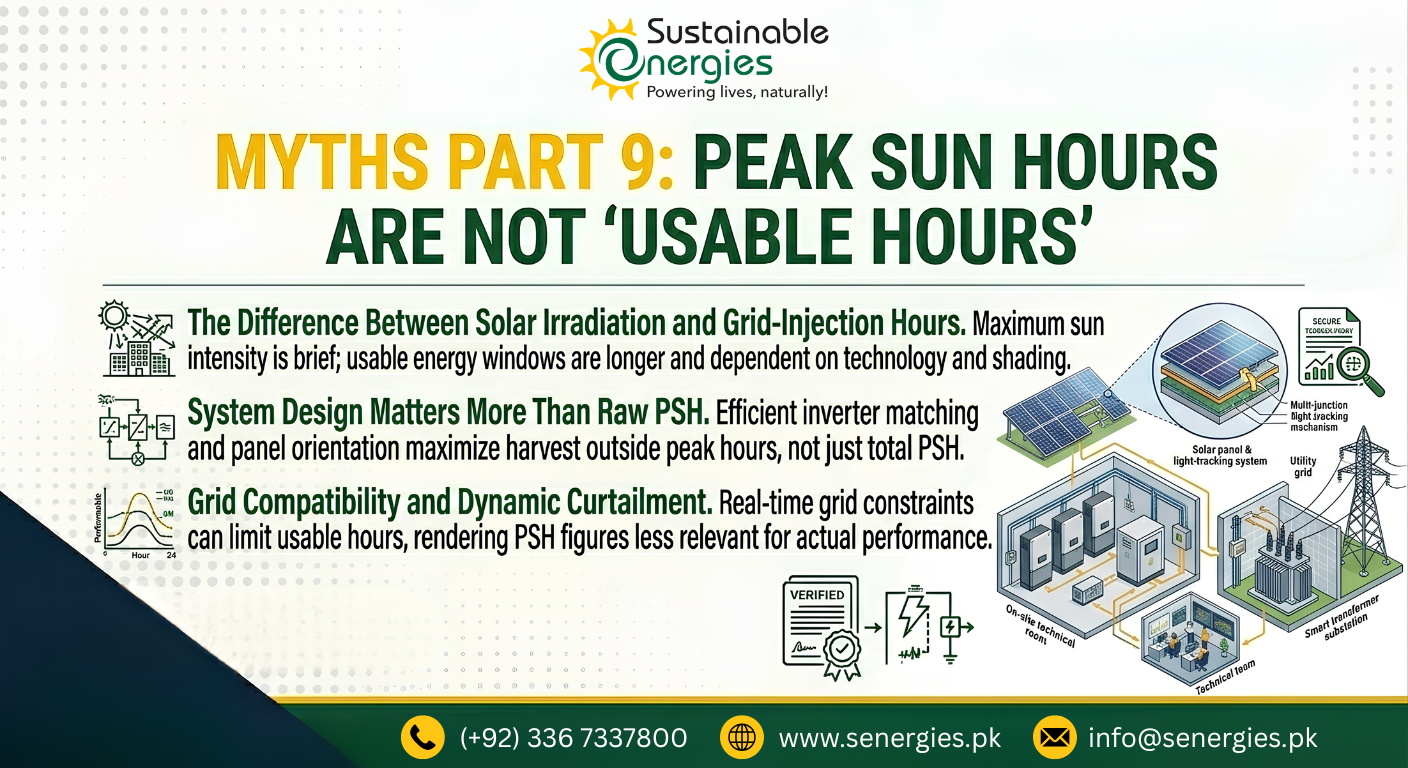
The Physical Reality: Power Is Not a Rectangle
Real-world solar arrays operate continuously across a timeline, not in neat structural blocks. Over a typical day in Pakistan, solar irradiance follows a predictable cycle: it ramps up slowly after sunrise, peaks toward solar noon, and steadily declines until sunset.
The resulting power-versus-time curve looks like a bell shape, not a clean rectangle. Daily energy production is the mathematical integral of usable power over time, not a basic calculation of “rated power × PSH”. This distinction directly impacts your battery charging windows and winter reliability estimates.
The “Non-Useful” Parts of Daytime Insolation
Not all incoming sunlight contributes equally to your net kWh generation. The morning and evening shoulders of the irradiance curve are inherently less productive due to specific engineering bottlenecks:
A portion of daily insolation is thermodynamically present but operationally inefficient. PSH includes this low-yield energy in its abstract total, but a real solar system cannot fully convert it into power.
Identical PSH Does Not Equal Identical Energy
Two distinct operational days can record the exact same PSH data point yet yield completely different kWh energy totals. This variance occurs due to three main factors:
Where Performance Ratio (PR) Fits: Performance Ratio exists precisely to normalize these limitations. While PSH describes the raw resource availability, PR describes actual system conversion efficiency. Together, PSH tells you how much sun you got, and PR confirms if the system behaved correctly.
Why This Matters More in Hybrid and Storage Systems
In simple grid-tied solar setups, misusing PSH metrics leads to over-optimistic financial projections. In hybrid and off-grid battery storage systems (BESS), it leads to absolute system failure. Sizing mistakes typically occur when designers assume a fixed, reliable charging window based solely on annual PSH averages while completely ignoring shoulder inefficiencies during winter.
A Better Mental Model
Instead of thinking: “This project site has 4.5 PSH.”
Train your team to think: “This site receives solar energy distributed unevenly over a moving time-domain curve, and only the high-exposure peak of that curve is highly productive.”
This shift — from flat averages to active curves — is the core divider between basic sales estimations and professional PV engineering.
Conclusion: Practical Takeaways for Solar Sizing
Peak Sun Hours are an excellent macro abstraction tool for comparing regional resources or filling baseline performance models, but they are a dangerous operating assumption. They should never be treated as guaranteed charging windows or a substitute for true time-domain analysis.
Solar assets do not operate on static spreadsheet averages; they operate in fluid time. Engineers who design with the bell curve in mind build resilient systems. Those who rely blindly on simple PSH numbers design systems that work perfectly — until real weather constraints arrive.