
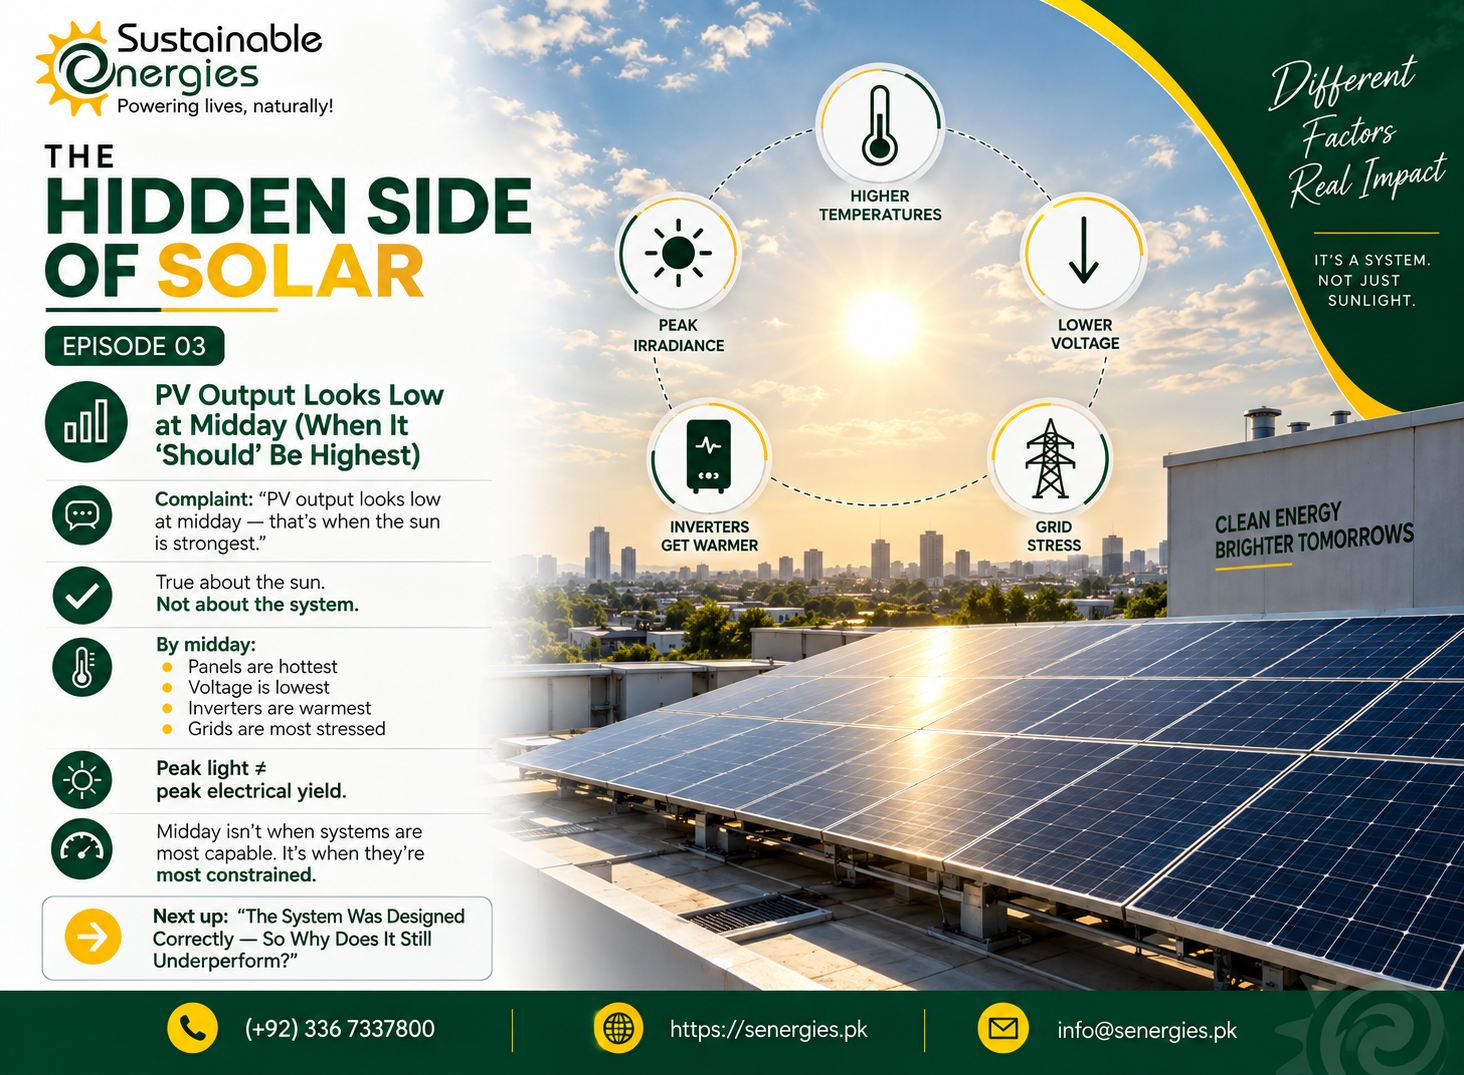
A recurring observation:
“PV output looks low at midday — that’s when the sun is strongest.”
The premise feels obvious. Solar irradiance peaks around midday. Therefore, system output should too.
And yet, field curves often show:
This is frequently interpreted as underperformance. In reality, midday is often when the most constraints activate simultaneously.
Applying Diagnostic Reasoning
Step 1: Separate irradiance from electrical yield
High irradiance does not guarantee proportionally high electrical output.
Solar modules convert light into electricity through semiconductor behaviour that is temperature sensitive.
As module temperature rises:
By midday, panels are not just illuminated — they are thermally saturated.
In hot climates especially, peak irradiance and peak electrical efficiency rarely coincide.
The sun is strongest. The modules are least efficient.
Step 2: Understand voltage-driven power loss
Many expect current to define PV output. In practice, voltage loss under heat often dominates.
As temperature rises:
Even if irradiance remains high, falling voltage reduces total power.
From the outside, this appears as missing generation.
From the inside, it is physics behaving normally.
Step 3: Identify stacked midday constraints
Midday is not just thermally intense for modules. It stresses the entire system:
Each constraint alone is manageable. Together, they compress the operating region.
This is why midday curves often flatten instead of peak sharply.
The system is negotiating multiple boundaries simultaneously.
Step 4: Recognise MPPT dynamics under stress
Maximum Power Point Tracking assumes stable electrical landscapes.
At midday:
MPPTs do not fail — they operate at the best available point under constrained conditions.
But that point may sit below theoretical maximum.
Step 5: Question the curve you’re seeing
Portal data often reinforces the perception of underperformance:
Without high-resolution measurement, midday behaviour is easy to misread.
What this symptom actually teaches
Midday is not when systems are most capable. It is when they are most stressed.
Peak irradiance coincides with:
The expectation of maximum output assumes that irradiance is the only active variable.
System literacy recognises that midday is where constraint stacking is most intense.
The system is not underperforming. It is operating at the intersection of its limits.