
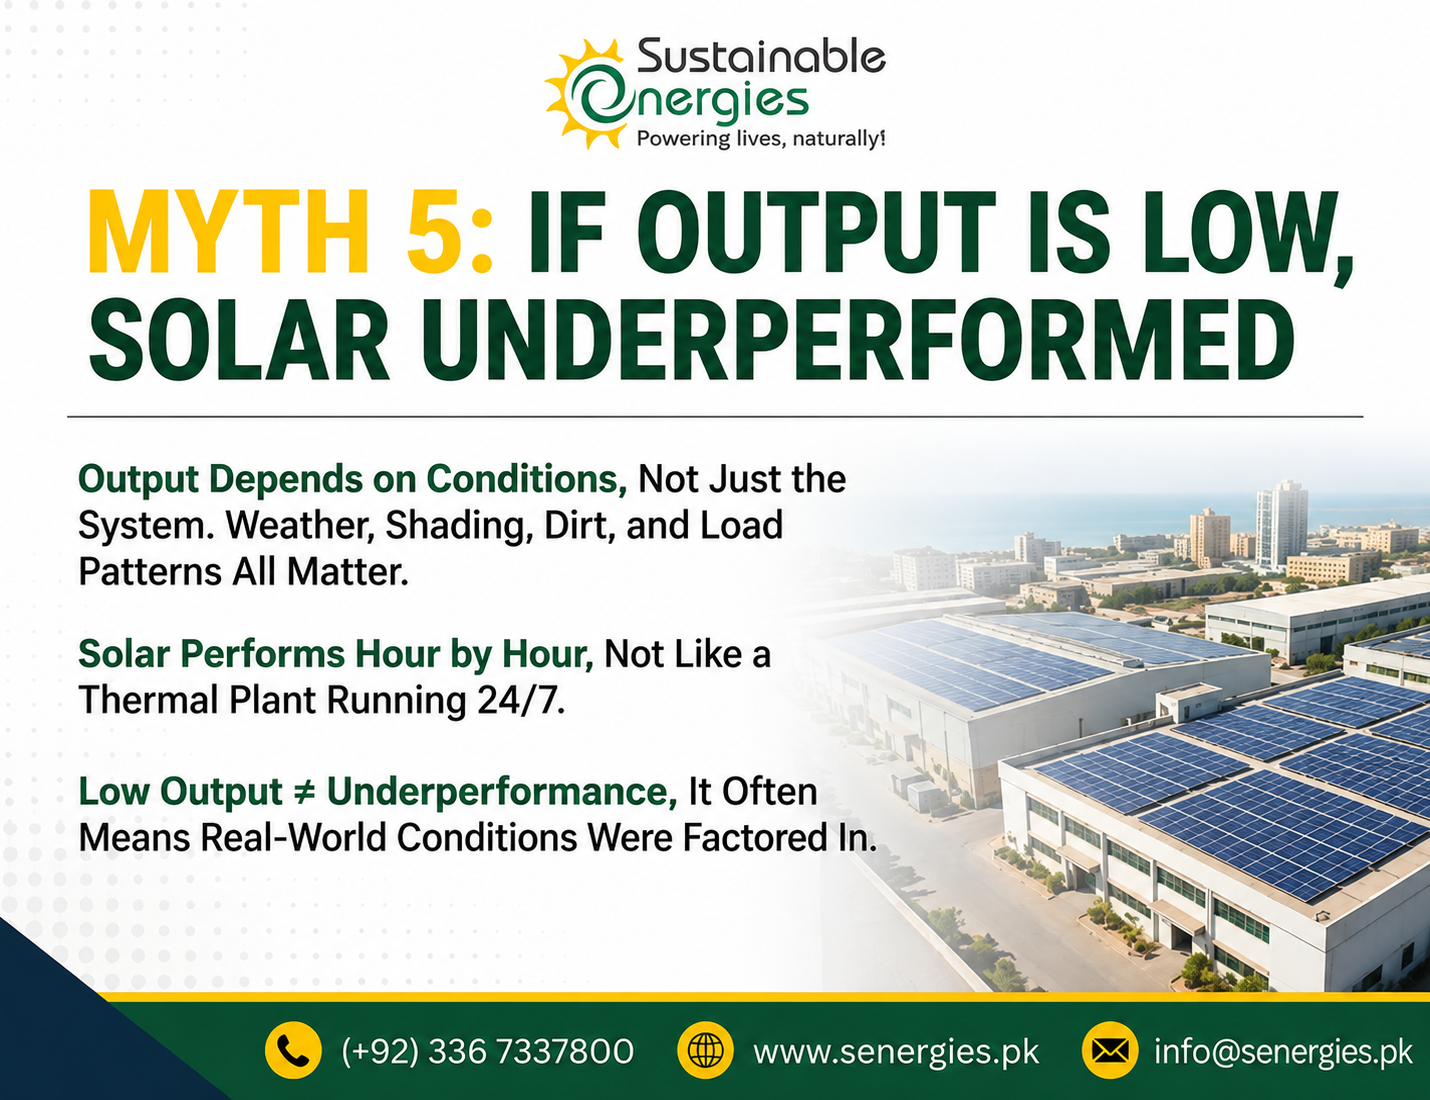
The Common Misunderstanding
Many clients reach the following conclusion:
“The system is producing less than expected, so something must be wrong.”
This conclusion is often based on comparing:
Although these comparisons appear reasonable, they overlook a critical variable: the actual solar irradiance received by the system.
Why Simple Output Comparisons Fail
Solar energy production is influenced by several environmental and operational factors beyond the installed capacity of the system. Actual output depends on:
As a result, two identical solar systems installed under different weather conditions can produce significantly different amounts of electricity while both continue operating exactly as designed.
This is precisely where Performance Ratio (PR) becomes indispensable.
What Performance Ratio Actually Tells Us
Performance Ratio (PR) measures how efficiently a photovoltaic system converts the available solar energy into usable electrical energy.
In simple terms:
PR compares what the system actually produced with what it should have produced under the same sunlight conditions.
Unlike raw energy production figures, PR removes the effect of changing weather conditions, making it one of the most reliable indicators of system performance.
Why PR Matters (Especially in Pakistan)
Pakistan presents several environmental conditions that make Performance Ratio particularly valuable when evaluating solar systems.
Without considering PR, comparing raw kWh values can easily lead to misleading conclusions.
Performance Ratio enables fair, objective, and apples-to-apples comparisons regardless of weather conditions.
Typical Performance Ratio (PR) Ranges
Under real operating conditions, the following PR ranges are generally accepted:
These ranges represent practical field performance rather than ideal laboratory conditions.
How to Explain Performance Ratio to Clients
Rather than focusing only on energy production, clients should understand that system health is evaluated through PR.
“Energy output alone doesn’t tell the full story. We evaluate system health using Performance Ratio.”
Or simply explain:
“Performance Ratio shows whether the system is performing as expected for the amount of sunlight it actually received.”
A Simple Way to Think About It
An easy analogy is:
Judging solar performance without Performance Ratio is like blaming a car for slow travel without checking the traffic conditions. PR tells you whether the car itself is running properly given the road conditions.
Why This Framework Matters
Using Performance Ratio as the primary evaluation metric provides several important benefits: